Tracing Goroutines in Realtime with eBPF
You've probably heard about eBPF before, it's getting more popular everyday with the extended observability and low-level control coverages it gets in Linux kernel.
But did you know that eBPF can also look inside the Go runtime?
Keep reading and I'll show you how we can use eBPF uprobes to trace goroutine lifecycle events and memory allocations as they happen, giving us a real-time view of what Go's scheduler is doing under the hood.
Here's my latest side project, also a winner of the eBPF Summit '25 Hackathon: xgotop. xgotop is a Go runtime tracing tool to observe goroutine state changes and memory allocations in near realtime.
This will be a two part series. In this article, we'll go through my thought process during the design and development of xgotop, also I'll explain some aspects of Go runtime internals, as well as using bpftrace to write PoCs for eBPF programs. The second one will cover turning the bpftrace PoC into a standalone project utilizing eBPF ringbuffers, hashmaps, LRU caches, and configurable sampling using C, Go and cilium/ebpf-go.
If you just want to trace Go programs, the built-in execution tracer (
runtime/trace) is the right tool for the job. It's lower overhead and gives you a complete picture of goroutine scheduling, blocking, and more. The eBPF approach we'll explore here is more expensive and is meant as an exploration of what's possible when combining eBPF with Go runtime internals.

All Go source code snippets you'll see here are a part of Go 1.26

The Life of a Goroutine
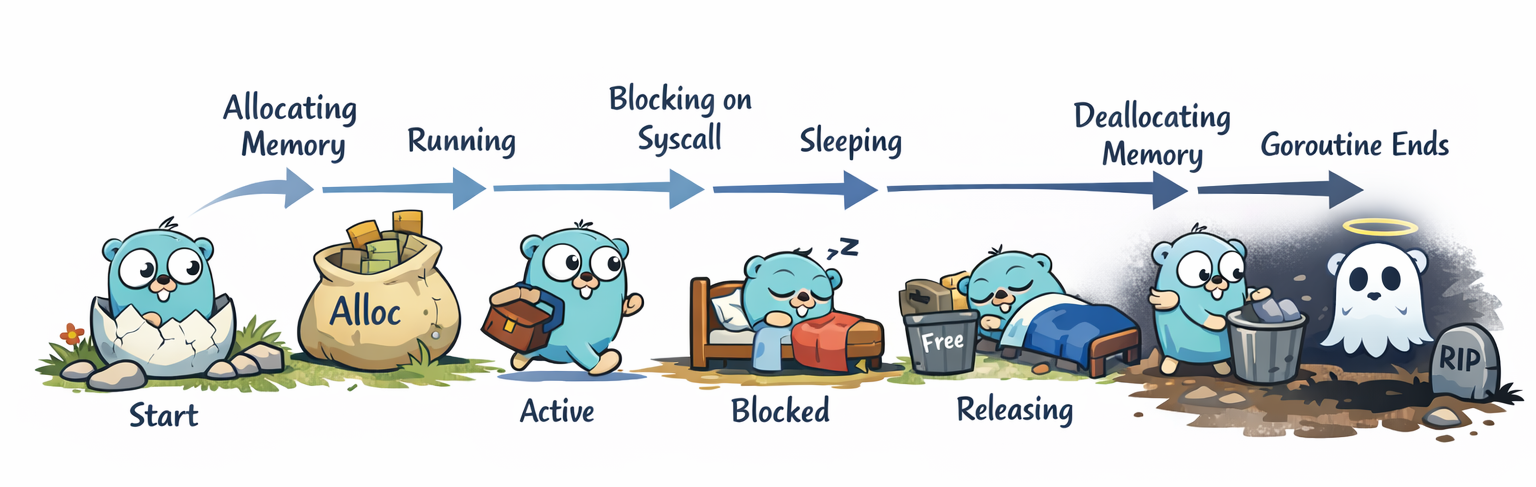
As we all human beings do (and AI agents, if you are one), goroutines too start living, gather belongings, and eventually die after giving all those belongings back to where they got them from. During their lifetime they get to switch between different states for thousands of times. These changes happen when a goroutine is scheduled, parks in the runtime, enters or exits a syscall, gets preempted, or exits. Memory allocation is a separate runtime event that can happen while the goroutine is running user code.
Unlike us, goroutines live much shorter and so observing their lives is a bit hard by just logging stuff to the terminal. You can easily miss ordering of events within a millisecond for example. To peek in with more detail, we need more than logs. What if there was an interface to tell us whenever a goroutine switch between states, and do memort operations?
Fortunately we have that. Goroutines, as being a part of the Go runtime, call specific functions inside the runtime library to start doing those operations. That happens in userspace. And we also have eBPF, which lets us call arbitrary code before a specific function starts and ends executing.
By putting specific Go runtime functions and eBPF userspace probes together, we can perform some simple tracing of goroutines.
Inspecting Go Runtime
Let's start by understanding the goroutine lifecycle better. Goroutine is an abstraction over Go functions. It's run as a lightweight thread in Go runtime and is initiated with a specific function and a parent goroutine. All goroutines have a parent which is another goroutine, except the initial goroutine, which is attached to the main function when you run a Go binary.
Each goroutine can have more than one children, so it can be said that the relationship between parent and children look like a Linux process tree.
Goroutines are defined by the struct named g in Go runtime:
src/runtime/runtime2.go1type g struct {
2	goid       uint64
3	parentGoid uint64          // goid of goroutine that created this goroutine
4	startpc    uintptr         // pc of goroutine function
5    atomicstatus atomic.Uint32 // atomic status code
6    ...
7}
As you can see, g stores its own and its parent's id, current state, the function it was started for, as well as some other runtime related information which are out of the scope of this article.
Below are the possible states a goroutine can be in, which are stored in g.atomicstatus (skipping unused and scan ones, find the whole list here):
| State | Executes User Code | On Run Queue | Notes |
|---|---|---|---|
_Gidle | No | No | Newly allocated, not initialized |
_Grunnable | No | Yes | Ready to run |
_Grunning | Yes | No | Actively executing |
_Gsyscall | No | No | Executing a syscall, assigned an M, must not touch g.m.p |
_Gwaiting | No | No | Blocked in the runtime, usually recorded somewhere so it can be readied |
_Gdead | No | No | Exited, on free list, or being initialized |
_Gcopystack | No | No | Stack is being moved |
_Gpreempted | No | No | Suspended for suspendG preemption, not yet owned by a readying party |
_Gleaked | No | No | Leaked goroutine caught by GC |
_Gdeadextra | No | No | _Gdead goroutine attached to an extra M for cgo callbacks |
These variables give us enough opportunity to continuously trace one's lifecycle. But before starting to do that, we need to know which functions are responsble of creating goroutines and changing their states. In practice, we can trace goroutine lifecycle changes by hooking runtime state-transition points.
Instead of finding and hooking every state changing function in the Go runtime, we can do a little hack: runtime.casgstatus is one of the key low-level helpers because many scheduler transitions go through it. By hooking into casgstatus, we can observe a large portion of the important goroutine state changes, even though some hot paths use direct atomic CAS1 operations or specialized helpers instead.
src/runtime/proc.go1func casgstatus(gp *g, oldval, newval uint32)
For memory operations, we have these runtime functions used by goroutines:
runtime.makemap_small: Initializes a new runtime map object formake(map[k]v)andmake(map[k]v, hint)expressions wherehint <= abi.MapGroupSlots.runtime.makemap: Initializes a new runtime map object formake(map[k]v, hint).
Before Go 1.24, map making runtime functions also allocate memory for the hash buckets, the internal data structure for Go maps. However Go 1.24 and further versions have a Swiss-table based map implementation so the internal allocation is different.
runtime.makeslice: Creates a new runtime slice data structure and allocates memory for the underlying array.runtime.newobject: Creates a new arbitrary Go object with the given type.
You might've noticed that I didn't include the function(s) for memory deallocation. Tracking if a specific object (custom type, etc.) is dellocated is not a trivial operation. We might take a look at how that happens and how it could be observed in a following article later.
With the common scheduling states in mind, we can draw a simplified goroutine state machine focused on _Grunnable, _Grunning, _Gwaiting, _Gsyscall, _Gpreempted, and _Gdead. I'm leaving _Gidle out of the main diagram because then the goroutine is just allocated and not yet initialized, and I'm omitting specialized states like _Gcopystack, _Gleaked, and _Gdeadextra.

And now we're ready to write some eBPF hooks to take a closer look at those functions' arguments in realtime!
Using bpftrace to Validate Our Idea
Whenever I have a new eBPF related idea, I actually prefer writing a simple PoC in bpftrace before jumping into a full eBPF program design and implementation. That helps me to see if that idea is viable or not faster.
For those who are not familiar with, bpftrace is a program/parser/transpiler which can translate a special script format to a whole eBPF program with multiple hooks. It has some cool simplifications, for example you can define C-style structs and use them to decode complex in-kernel and in-runtime data structures using pointer dereference, and bpftrace automatically does safe memory handling:
 1struct g {
 2    uint64_t goid; // offset=152 size=8
 3};
 4
 5uprobe:./testserver:runtime.newobject
 6{
 7    $goroutine = reg("r28");
 8    $g = (struct g *)($goroutine);
 9    $goroutine_id = $g->goid;
10    ...
11}
That ((struct g *)reg("r28"))->goid would require 2 extra variables and BPF CO-RE memory copy calls in eBPF C code for example.
Another cool feature is that we can directly get current register values via the reg() function. And as Go uses registers for function arguments in its call convention2, we can directly access them using reg and custom type definitions. Such as the example above, which uses reg("r28") to get the current goroutine object in arm64 architecture, and use a custom defined struct g type to access the goid field of it.
A Little More of Go Runtime Magic
Let's see which Go runtime function arguments we can peek into. As a refresher, these are the functions we'll hook:
src/runtime/...1func casgstatus(gp *g, oldval, newval uint32)
2func newobject(typ *_type) unsafe.Pointer
3func makeslice(et *_type, len, cap int) unsafe.Pointer
4func makemap(t *abi.MapType, hint int, m *maps.Map) *maps.Map
We've took a look into runtime.g struct before, the new runtime types here are: abi.MapType, and runtime._type which is actually defined to be a reference to abi.Type:
src/runtime/type.go1type _type = abi.Type
abi.Type
The runtime representation of a Go type in Go's ABI. Defines the type's total size, kind, alignment, string form, etc.
src/internal/abi/type.go 1type Type struct {
 2	Size_       uintptr
 3	PtrBytes    uintptr // number of (prefix) bytes in the type that can contain pointers
 4	Hash        uint32  // hash of type; avoids computation in hash tables
 5	TFlag       TFlag   // extra type information flags
 6	Align_      uint8   // alignment of variable with this type
 7	FieldAlign_ uint8   // alignment of struct field with this type
 8	Kind_       Kind    // what kind of type this is (string, int, ...)
 9	// function for comparing objects of this type
10	// (ptr to object A, ptr to object B) -> ==?
11	Equal func(unsafe.Pointer, unsafe.Pointer) bool
12	GCData    *byte
13	Str       NameOff // string form
14	PtrToThis TypeOff // type for pointer to this type, may be zero
15}
The Kind_ field here defines what kind of type this one is, which is defined in Go source code as:
src/internal/abi/type.go 1// A Kind represents the specific kind of type that a Type represents.
 2// The zero Kind is not a valid kind.
 3type Kind uint8
 4
 5const (
 6	Invalid Kind = iota
 7	Bool
 8	Int
 9	Int8
10	Int16
11	Int32
12	Int64
13	Uint
14	Uint8
15	Uint16
16	Uint32
17	Uint64
18	Uintptr
19	Float32
20	Float64
21	Complex64
22	Complex128
23	Array
24	Chan
25	Func
26	Interface
27	Map
28	Pointer
29	Slice
30	String
31	Struct
32	UnsafePointer
33)
abi.MapType
The actual metadata definition of a Go map, including the native/custom types of keys, values, the hash function func(unsafe.Pointer, uintptr) uintptr, etc.
src/internal/abi/map.go 1type MapType struct {
 2    Type
 3    Key        *Type
 4    Elem       *Type
 5    Group      *Type
 6    Hasher     func(unsafe.Pointer, uintptr) uintptr
 7    GroupSize  uintptr
 8    KeysOff    uintptr
 9    KeyStride  uintptr
10    ElemsOff   uintptr
11    ElemStride uintptr
12    ElemOff    uintptr
13    Flags      uint32
14}
The *Type here is a pointer to abi.Type, which is explained above.
Returning back to the functions we'll hook, here are what we can learn about the goroutines by decoding the function arguments in bpftrace/eBPF:
casgstatus-> Goroutine ID, parent goroutine ID, old state, new statenewobject-> Memory size and the kind of the new objectmakeslice-> Length and capacity of the new slice, and the total memory size and the kind of itmakemap-> Hint (initial capacity), key/value types (their total sizes and kinds) of the new map, and the total memory size and the kind of it
xgotop.bt bpftrace Script
So let's try writing a simple bpftrace program/script to hook into these Go runtime functions. We first need a Go program to test our bpftrace code on. We will use an extremely simple HTTP server:
cmd/testserver/main.go 1package main
 2
 3import (
 4	"fmt"
 5	"net/http"
 6
 7	"github.com/gorilla/mux"
 8)
 9
10func main() {
11	r := mux.NewRouter()
12	r.HandleFunc("/books/{title}/page/{page}", GetBook)
13	http.ListenAndServe(":80", r)
14}
15
16func GetBook(w http.ResponseWriter, r *http.Request) {
17    vars := mux.Vars(r)
18    title := vars["title"]
19    page := vars["page"]
20    fmt.Fprintf(w, "You've requested the book: %s on page %s\n", title, page)
21}
When you build and run this testserver program and send an HTTP request via curl or httpie or your favorite HTTP client, you'll see that it's working:
1$ go build -o testserver ./cmd/testserver
2
3$ ./testserver &
4
5$ curl localhost/books/test123/page/45
6You've requested the book: test123 on page 45
But that's not the point, obviously. Now we can write the actual code, which is the bpftrace code. We'll hook into the functions casgstatus, newobject, makeslice, and makemap, then use the registers to decode actual function call arguments to observe goroutine lifecycle events in specific points in time.
Below is the full bpftrace proof-of-concept implementation for our goroutine tracer:
xgotop.bt 1struct g {
 2    uint8_t _pad1[152];
 3    uint64_t goid; // offset=152 size=8
 4    uint8_t _pad2[112];
 5    uint64_t parentGoid; // offset=272 size=8
 6    uint8_t _pad3[16];
 7    uint64_t startpc; // offset=296 size=8
 8};
 9
10struct _type {
11    uint64_t size; // offset=0 size=8
12    uint8_t _pad1[15];
13    uint8_t kind; // offset=23 size=1
14}
15
16struct mapType {
17    uint8_t _pad1[48];
18    struct _type *key; // offset=48 size=8
19    struct _type *elem; // offset=56 size=8
20};
21
22// func casgstatus(gp *g, oldval, newval uint32)
23uprobe:./testserver:runtime.casgstatus
24{
25    $gp = (struct g *)reg("r0");
26    $goid = $gp->goid;
27    $parentGoid = $gp->parentGoid;
28    $startpc = $gp->startpc;
29
30    $goroutine =  (struct g *)reg("r28");
31    $goroutine_id = $goroutine->goid;
32
33    $status = reg("r2");
34
35    printf("[%llu] pid=%d goid=%llu parentGoid=%llu startpc=%llx status=%llu [goroutine_id=%lld]\n", nsecs, pid, $goid, $parentGoid, $startpc, $status, $goroutine_id);
36}
37
38// func newobject(typ *_type) unsafe.Pointer
39uprobe:./testserver:runtime.newobject
40{
41    $g = (struct g *)reg("r28");
42    $goroutine_id = $g->goid;
43
44    $typ = (struct _type *)(reg("r0"));
45    $size = $typ->size;
46    $kind = $typ->kind;
47
48    printf("[%llu] g:%lld:runtime.newobject(size=%llu, kind=%llu)\n", nsecs, $goroutine_id, $size, $kind);
49}
50
51// func makeslice(et *_type, len, cap int) unsafe.Pointer
52uprobe:./testserver:runtime.makeslice
53{
54    $g = (struct g *)reg("r28");
55    $goroutine_id = $g->goid;
56
57    $typ = (struct _type *)(reg("r0"));
58    $size = $typ->size;
59    $kind = $typ->kind;
60
61    $len = reg("r1");
62    $cap = reg("r2");
63
64    printf("[%llu] g:%lld:runtime.makeslice(size=%llu, kind=%llu, len=%llu, cap=%llu)\n", nsecs, $goroutine_id, $size, $kind, $len, $cap);
65}
66
67// func makemap(t *abi.MapType, hint int, m *maps.Map) *maps.Map
68uprobe:./testserver:runtime.makemap
69{
70    $g = (struct g *)reg("r28");
71    $goroutine_id = $g->goid;
72
73    $maptyp = (struct mapType *)(reg("r0"));
74
75    $keysize = $maptyp->key->size;
76    $keykind = $maptyp->key->kind;
77    $valsize = $maptyp->elem->size;
78    $valkind = $maptyp->elem->kind;
79
80    $hint = reg("r1");
81
82    printf("[%llu] g:%lld:runtime.makemap(keysize=%llu, keykind=%llu, valsize=%llu, valkind=%llu, hint=%llu)\n", nsecs, $goroutine_id, $keysize, $keykind, $valsize, $valkind, $hint);
83}
Here's how every hook is written:
- I've defined
structsg,_type,mapTypeto be able to use internal Go typesruntime.g,abi.Typeandabi.MapType. Notice how I've used arbitraryuint8_tarrays in those structs as field paddings. The reason behind doing this is that we don't need most of those internal objects' fields - for example inruntime.gwe only need ID and parent ID. We can easily skip past the remaining ones using single-byte (uint8_t) arrays with a desired length. - Used
uprobe(userspace probe) to hook the runtime functions. These functions are a bit costly in the means of latency, however better for faster prototyping. Every hook in bpftrace can simply be written in 3 parts:
<kind>:<program>:<function>

uprobe:./testserver:runtime.makemap
- Used
r28to get the current goroutine'sgstruct3 - Casted the related registers (
r28,r0, ...) into the related in-script structs to inspect the function call arguments in better detail
If you run xgotop.bt with bpftrace while the testserver is running in the background and send some random HTTP requests to it, you'll see some interesting logs coming from bpftrace:
 1$ sudo bpftrace ./xgotop.bt
 2Attaching 4 probes...
 3[10348086967086] pid=19641 goid=1 parentGoid=0 startpc=51cf0 status=1 [goroutine_id=0]
 4[10348087023933] pid=19641 goid=1 parentGoid=0 startpc=51cf0 status=2 [goroutine_id=0]
 5[10348087033386] pid=19641 goid=1 parentGoid=0 startpc=51cf0 status=3 [goroutine_id=1]
 6[10348087051502] pid=19641 goid=1 parentGoid=0 startpc=51cf0 status=2 [goroutine_id=1]
 7[10348087054417] g:1:runtime.newobject(size=56, kind=25)
 8[10348087059165] g:1:runtime.newobject(size=128, kind=25)
 9[10348087066328] g:1:runtime.newobject(size=56, kind=25)
10[10348087069160] g:1:runtime.newobject(size=48, kind=25)
11[10348087071076] g:1:runtime.newobject(size=48, kind=25)
12[10348087076573] pid=19641 goid=1 parentGoid=0 startpc=51cf0 status=3 [goroutine_id=1]
13[10348087079363] pid=19641 goid=1 parentGoid=0 startpc=51cf0 status=2 [goroutine_id=1]
14[10348087081279] g:1:runtime.newobject(size=8, kind=57)
15[10348087083403] pid=19641 goid=1 parentGoid=0 startpc=51cf0 status=3 [goroutine_id=1]
16[10348087085818] pid=19641 goid=1 parentGoid=0 startpc=51cf0 status=2 [goroutine_id=1]
17[10348087087234] pid=19641 goid=1 parentGoid=0 startpc=51cf0 status=3 [goroutine_id=1]
18[10348087097812] g:1:runtime.newobject(size=144, kind=25)
19[10348087099978] g:1:runtime.newobject(size=48, kind=25)
20[10348087103726] g:1:runtime.newobject(size=32, kind=25)
21[10348087106266] g:0:runtime.newobject(size=440, kind=25)
22[10348087108599] pid=19641 goid=0 parentGoid=0 startpc=0 status=6 [goroutine_id=0]
23[10348088014562] pid=19641 goid=21 parentGoid=1 startpc=1e3710 status=1 [goroutine_id=0]
24[10348088057207] pid=19641 goid=1 parentGoid=0 startpc=51cf0 status=3 [goroutine_id=1]
25[10348088069535] pid=19641 goid=1 parentGoid=0 startpc=51cf0 status=2 [goroutine_id=1]
26[10348090552043] pid=19641 goid=21 parentGoid=1 startpc=1e3710 status=2 [goroutine_id=0]
27[10348090586900] g:21:runtime.newobject(size=48, kind=25)
28[10348090607307] g:21:runtime.newobject(size=80, kind=25)
29[10348090610139] g:21:runtime.newobject(size=16, kind=25)
30[10348090611555] g:21:runtime.newobject(size=64, kind=25)
31[10348090615678] g:21:runtime.makeslice(size=128, kind=25, len=4, cap=4)
32[10348090618218] g:21:runtime.newobject(size=88, kind=25)
33[10348090620009] g:21:runtime.makeslice(size=1, kind=8, len=4096, cap=4096)
34[10348090627630] g:21:runtime.makeslice(size=128, kind=25, len=4, cap=4)
35[10348090628921] g:21:runtime.makeslice(size=1, kind=8, len=4096, cap=4096)
You can see that after an HTTP request is sent:
- A new goroutine with ID
21is spawned to handle it (startpcof0x1e3710is probably theGetBookfunction oftestserver) - There are two slices allocated with type
Uint8and length4096(g:21:runtime.makeslice(size=1, kind=8, len=4096, cap=4096)), which are probably the request and response body buffers - There are arbitrary structs allocated for various reasons (
g:21:runtime.newobject(size=..., kind=25))
As you can see, we can now trace arbitrary goroutines running in a specific Go executable!
We can stop right here, feel free to play around with xgotop.bt by changing hooks, adding new ones, inspecting another Go program, etc.
In the next part, we will turn this PoC into a standalone project utilizing eBPF ringbuffers, hashmaps, and event sampling using C, Go and cilium/ebpf-go. Until then, stay tuned.
References
- ozansz/xgotop
- Go runtime:
runtime/proc.go - Go runtime:
runtime/map.go(map internals) - bpftrace
- cilium/ebpf-go
-
Go uses different registers for different architectures: https://go.dev/src/cmd/compile/abi-internal#amd64-architecture https://go.dev/src/cmd/compile/abi-internal#arm64-architecture ↩︎
-
In
arm64Go ABI, r28 is the register that stores the current goroutine object's memory location ↩︎